
Benchmarking
The Employee Engagement Benchmarks Q3 2025
Gain valuable insights for measuring your team’s engagement levels, drivers, and eNPS trends with our benchmark data – collated from over 500,000 UK employee responses from various industries and organisations. This data is from July to September 2025 (Q3 2025).
Enter your email address below to subscribe to our quarterly benchmarking emails:
See the latest benchmarking results for your industry
See how similar sized organisations are doing
Benchmarks at a glance
In a hurry? Check out this short overview video which runs through all of the key findings in this Q3’s Employee Engagement Benchmarks.
In this video you’ll get the latest on eNPS, Engagement Index, and Response Rates.
Engagement Index
Hive’s Engagement Index is made up of the responses to 3 core questions measuring Loyalty, Advocacy and Pride across an organisation (measured on a scale of 0 to 10 with a result of 7 and above indicating a positive score).
Compare your organisation’s Engagement Index against the benchmark to get a snapshot of how your employees are feeling.
Not sure what your score is? We can help.
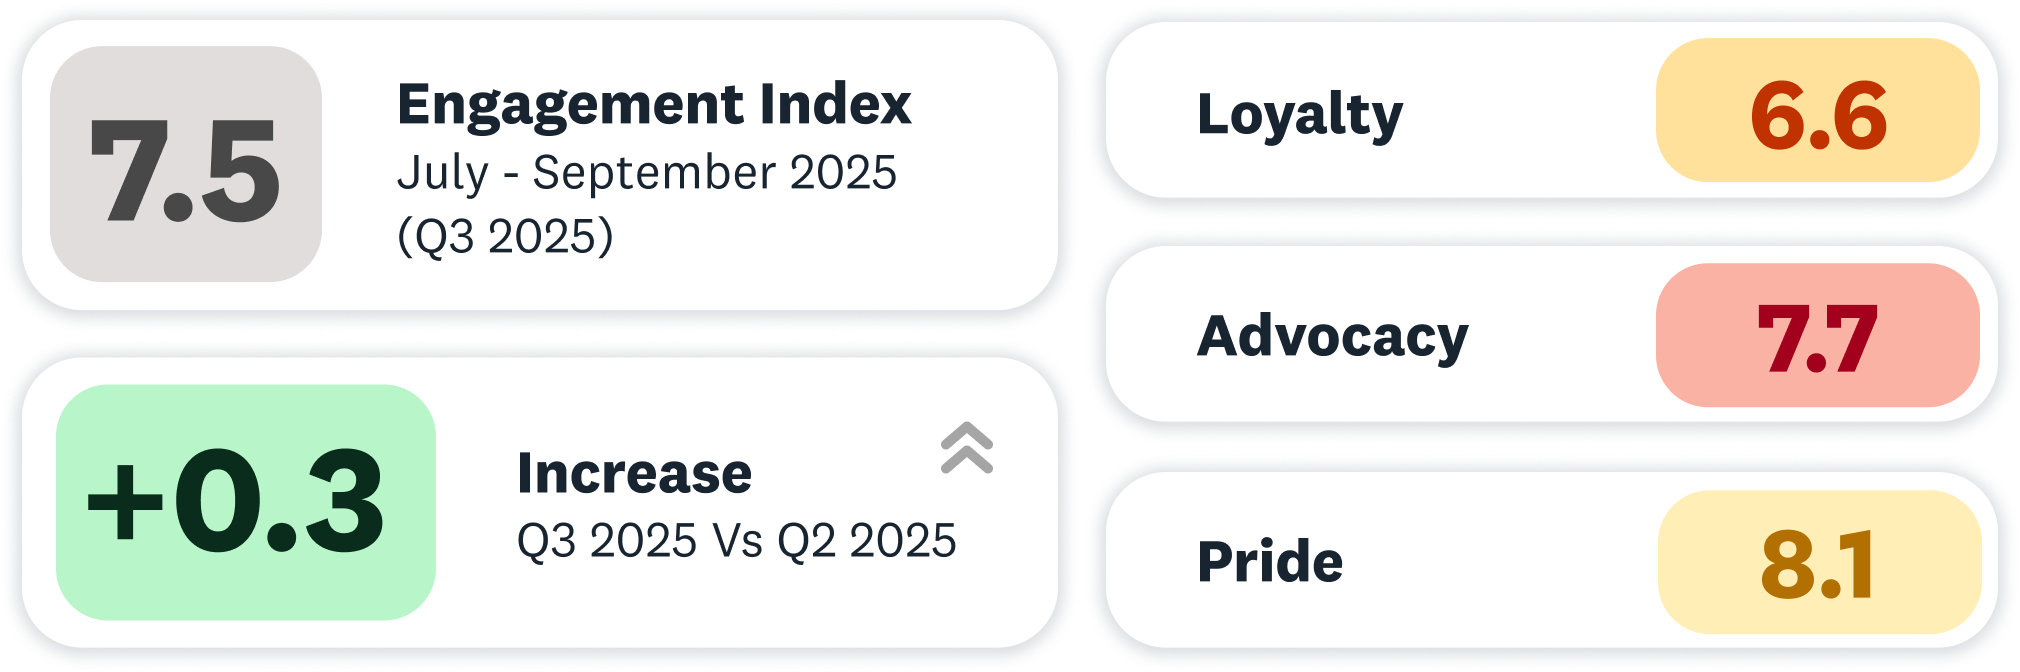


Looking at overall engagement this quarter, the picture is encouraging. The Engagement Index has risen to 7.5, up from 7.2 in Q2, suggesting that employees are feeling more connected and involved in their work. Loyalty has edged up slightly to 6.6, while advocacy climbed to 7.7, showing that more people are willing to recommend their organisation as a good place to work. Pride has seen the strongest lift, reaching 8.1 — a clear signal that employees are feeling a stronger sense of purpose and achievement in what they do.
Compared with previous quarters, Q3 2025 shows consistent improvement across the board, highlighting that organisations investing in culture, listening, and meaningful action on feedback are seeing tangible results in how their people feel and engage. These gains often feed directly into stronger retention and performance outcomes, showing that engagement improvements aren’t just cultural, they’re commercial.
Q3’s engagement scores paint an interesting picture. Technology and Professional Services continue to lead the way, holding steady around 7.9 and 7.7 respectively. Engagement here appears resilient, suggesting employees in these areas are reporting consistently positive experiences.
Housing Associations and Healthcare score slightly lower, in the mid-7s, indicating solid engagement but also potential opportunities for improvement. These sectors might benefit from keeping a close eye on trends and exploring what small shifts could make a meaningful impact.
Education and Government register lower scores, around 6.4–6.8. These lower engagement levels are mirrored in response rates, particularly for Education, highlighting the importance of psychological safety and visible follow-up to encourage participation and honest feedback. While these scores are not alarming, they do suggest there’s more variation in how employees are experiencing their work. Surveying these teams more frequently, listening to feedback, and identifying patterns could help uncover what matters most to employees in these contexts.
Overall, the picture this quarter shows, is that engagement isn’t uniform. Tracking scores over time, combining them with open-text feedback, and using tools like dashboards or key driver analysis can help organisations uncover insights that go beyond the numbers. Even small patterns can point to meaningful areas for action and improvement across industries.
Looking across organisations this quarter, engagement tells an interesting story. Smaller teams of 0–250 employees started strong, scoring 7.4 in April and May. They dipped slightly to 7.3 mid-quarter but bounced back to 7.4 in September. Even in tight-knit teams, small shifts in workload, leadership, or change can ripple through engagement. Keeping communication open, celebrating wins, and quick check-ins can help maintain the energy and connection that make these smaller teams thrive.
Mid-sized organisations of 251–500 employees also began the quarter at a healthy 7.4, but engagement dipped to 7.2 in August and September. These teams can experience growing pains — new processes, evolving roles, and expanding team structures can quietly chip away at morale. Looking at what really drives engagement and acting on those insights can prevent small dips from turning into bigger challenges. Left unchecked, these dips can ripple into slower decision-making and higher recruitment costs, making proactive listening a smart business investment.
This is consistent with the eNPS decline in the same group, showing that even slight drops in engagement can translate into reduced advocacy if not addressed.
Teams in the 501–1,000 employee range remained steady at 7.3 throughout the quarter. Stability is good, but it can mask pockets of disengagement. By digging into the trends and insights behind the numbers, managers can spot subtle issues early and take action to keep engagement strong before it affects wider team performance.
Larger teams, with 1,001–5,000 employees, started the quarter around 7.1 and gradually climbed to 7.4 in September. Engagement in bigger organisations can be harder to influence day-to-day, as employees may feel less visible. Using pulse surveys, check-ins, and reporting insights to understand what’s working and where support is needed can help leaders make small, targeted changes that have a big impact. Sustained engagement at this scale builds stability, the kind that supports consistent delivery, higher productivity, and smoother change adoption.
Finally, in very large organisations of 5,001+ employees, engagement stayed flat at 6.8 over the quarter. Here, engagement challenges are often about scale. Leaders can make a difference by focusing on system-level improvements, giving managers clear insights to act locally, and prioritising initiatives that create the biggest positive impact across teams. Combined with their eNPS drop, it suggests that in very large organisations, maintaining strong advocacy may require more than just steady engagement — targeted interventions and clear communication loops are essential.
Across every size, the story is clear: engagement isn’t just a number, it’s a reflection of how people experience their work. By uncovering trends, understanding what drives engagement, and acting on insights, leaders can turn survey data into meaningful action, helping their teams feel seen, valued, and energised.
Survey Response Rates
Participation is the heartbeat of any survey — it’s how you turn numbers into a story you can act on. This quarter, response rates show some clear contrasts across both industries and organisation sizes.
Looking at industries, Hospitality led the way with 83% participation, Manufacturing at 79%, and Creative & Media at 77%. Housing Associations and Construction & Heavy Industry both held solid engagement around 71%, while Technology hit 65%. On the lower end, Healthcare (12%), Education (24%), and Entertainment & Recreation (43%) highlight areas where engagement might be more challenging.
High response rates often reflect teams that feel heard and see the impact of their feedback, while lower rates can point to barriers like survey accessibility, timing, or uncertainty about how feedback is used. Psychological safety plays a huge role here — when employees feel safe to speak up without fear of judgment or repercussion, they’re far more likely to participate honestly and fully. This theme of safety and visibility also underpins eNPS and engagement scores; when people feel confident their voices are heard, both participation and advocacy tend to improve. Ultimately, high participation rates are early indicators of a healthy culture, one that’s more adaptive, resilient, and able to sustain performance over time.
Small to mid-sized organisations (0–250 and 251–500 employees) saw 57% and 65% of their people responding, while the largest organisations (5,001+) had a strong 82%. This ties back to the Engagement Index in these sizes — mid-sized organisations with lower engagement may need to focus on making surveys more visible and meaningful to encourage participation.
Interestingly, mid-tier organisations with 1,001–5,000 employees were lower at 37%, suggesting that in some mid-sized teams, reaching everyone can be trickier than expected.
To improve participation, it helps to make surveys easy to access, explain why they matter, and show follow-up actions. When employees see their input influencing real change, they’re far more likely to take the time to share their voice.
employee Net Promoter Score (eNPS)

July - September 2025
(Q3 2025)
Employee Net Promoter Score (eNPS) is an internationally recognised measure of engagement using the question ‘How likely are you to recommend our organisation as a good place to work?’ with detractors, passives and promoters. A positive score means an organisation has more advocates (promoters) than it does detractors. It is measured on a -100 to +100 scale.
What does a good eNPS score look like?
+41 and above is outstanding
+21 to +40 is very good
-10 to +20 is a typical score
-11 and below is a low, concerning score.
This quarter’s benchmarks remind us just how differently industries are experiencing employee engagement, and how much context matters when interpreting the numbers.
Hospitality continues to lead the pack, peaking at 38 in May and holding at 31 in September. For a sector often challenged by turnover, this is notable stability. It raises an interesting question: are improvements in employee voice and recognition playing a role here, or are service-focused businesses finding new ways to keep their people motivated?
Technology also had a strong quarter, climbing from 31 in April to 35 in September. With innovation and skills development at the heart of this industry, it could suggest that employees are responding positively to career growth opportunities and future-focused investment. That engagement often translates into faster innovation cycles and stronger commercial agility — vital advantages in a fast-moving sector. Professional Services showed similar steadiness in the low 30s, hinting that clarity and progression might be keeping engagement on track.
Not every industry is trending upwards. Education remained flat at –1 or –2 throughout the quarter, while Government improved slightly from –22 in April to –13 in September. These scores suggest engagement is still low in these sectors, raising questions for leaders: what factors might be influencing employee sentiment, and where could small changes make a difference?
A good place to start is by asking employees directly through quick pulse surveys or team check-ins, and looking at key drivers in your survey reporting to identify where action could have the biggest impact.
Healthcare slipped, from 22 in June to 20 in September. While the decline is small, in a sector under continuous pressure, even marginal drops can signal fatigue or strain setting in. This is reflected in Engagement Index trends too, which show Healthcare remaining in the mid-7s, pointing to a sector that’s generally engaged but possibly feeling the strain of sustained pressures.
There were also some encouraging shifts. Housing Associations rose from 25 in April to 30 in September, while Nonprofits made one of the biggest leaps — moving from just 1 to 14 in the same timeframe. Both sectors are heavily purpose-driven, which could be reinforcing engagement when people feel their work connects to a mission.
On the other hand, Creative and Media dropped significantly, sliding from 29 in April down to 17 in September. Engagement scores for this sector also trend lower than some others, suggesting that fluctuating client demands or industry volatility might be affecting both morale and advocacy. In industries facing constant flux and client demand, this could reflect instability or uncertainty filtering into employee sentiment.
Overall, Q3 paints a mixed picture: some industries are building momentum, while others are stuck in disengagement. The opportunity for leaders is clear — dig into the “why” behind these numbers, ask what’s shaping employee sentiment in your own sector, and use that insight to drive action where it matters most. When employees feel heard and empowered, it shows up in everything from customer experience to service quality and financial resilience.
These patterns echo the response rate trends we see across industries, where sectors like Healthcare and Education have lower participation, reminding leaders that engagement, advocacy, and survey participation are all intertwined.
The latest data from Q3 2025 reveals a mixed picture across organisation sizes, and some telling shifts worth paying attention to.
Smaller organisations (0–250 people) continue to lead on employee advocacy, holding steady with eNPS scores of 20–21 across the quarter. This aligns with engagement scores in smaller teams that also started the quarter strong, suggesting that where people feel connected and supported, both advocacy and engagement tend to hold up. That’s comfortably higher than other groups, but there’s been a small slide since spring (from 22 in April down to 20 by September). It’s a reminder that even in close-knit teams, engagement can dip if people feel stretched or overlooked.
The sharpest challenge sits with organisations in the 251–500 range. Their eNPS dropped from 15 in May to just 5 in September — the lowest of any group. This mirrors the dip seen in their Engagement Index, reinforcing the idea that mid-sized teams can struggle with maintaining a consistent culture without targeted listening strategies. This ‘in-between’ size is notoriously tough to manage: sometimes too big where people may feel disconnected, but not yet with the scale or infrastructure to keep culture consistent. Without deliberate listening strategies and strong manager capability, cracks can quickly appear.
At the other end of the spectrum, larger mid-sized organisations (1,001–5,000 people) tell a different story. Their scores rose from 6 in May to 14 in September, more than doubling in just a few months. That kind of turnaround suggests that when these organisations invest in culture, leadership, and acting on feedback, it pays off. At this scale, listening isn’t a “nice to have” — it’s the lever that keeps people connected, and performing at their best, with higher advocacy often linked to stronger retention and customer outcomes.
Meanwhile, the very largest organisations (5,001+) have slipped slightly, dropping from 14 in spring to 9 by September. With size comes complexity, and without strong feedback loops, silos and bureaucracy can quickly erode advocacy. The lesson here? Scale doesn’t have to mean disengagement, but it takes deliberate effort to keep people’s voices heard.
Taken together, the Q3 benchmarks for eNPS show that employee engagement is moving unevenly. Some organisations are finding momentum, others are struggling to hold onto it. But one thing’s clear: the organisations seeing positive movement are the ones not just collecting feedback, but really listening to it, and acting on it. That consistency in action often correlates with better retention, fewer absence issues, and more stable business performance overall.

Keep your finger on the pulse
Receive our future benchmarking newsletter featuring key data and expert commentary delivered straight to your inbox
Enter your email address below to subscribe to our quarterly benchmarking emails:
